Showing posts with label cointegration. Show all posts

Saturday, March 26, 2022

rerun with adf test on mobility

After filtering moblity on adf p-value, the number available mobility test are much smaller. 

On ECS323 Lambda server 
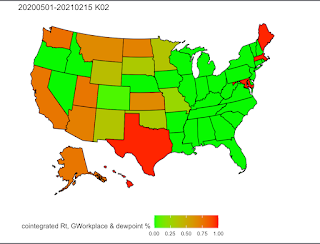
K02, 
18:28, auto_county_cajo_20200501-20210215-01percent-K02.R
18:33 auto_county_cajo_20200501-20210215-05percent-K02.R
18:39 auto_county_cajo_20200501-20210215-10percent-K02.R
19:02 K02, summary and plot udpated. Similar figures. 

K03
19:20.  auto_county_cajo_20200501-20210215-01percent-K03.R
19:27 auto_county_cajo_20200501-20210215-05percent-K03.R
19:32, auto_county_cajo_20200501-20210215-10percent-K03.R

K04
19:42 auto_county_cajo_20200501-20210215-01percent-K04.R
19:47 auto_county_cajo_20200501-20210215-05percent-K04.R
19:52 auto_county_cajo_20200501-20210215-10percent-K04.R

K05
20:15 auto_county_cajo_20200501-20210215-01percent-K05.R
20:32 auto_county_cajo_20200501-20210215-05percent-K05.R
20:44 auto_county_cajo_20200501-20210215-10percent-K05.R

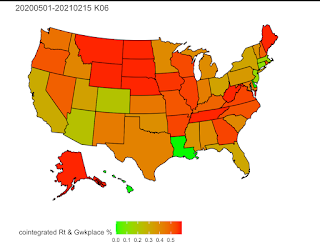
K06
20:56 auto_county_cajo_20200501-20210215-01percent-K06.R
21:05 auto_county_cajo_20200501-20210215-05percent-K06.R
21:11 auto_county_cajo_20200501-20210215-10percent-K06.R

21:42, Redo all plots, 

21:43 - 23:11, Rmd to generate summary table based  cval=1% cajo test. There was an index error to find out the appropriate numerators. It should be chr '2' or chr '3', not integer 2 or 3. This is a very tricky error. 


Counties with adf_p-value > 0.2 for dewpoint

McKenzie

North Dakota

Williams

North Dakota

Fresno

California

Flathead

Montana

Madera

California

Mountrail

North Dakota

Stark

North Dakota

Juneau

Alaska

Pennington

South Dakota

Santa Cruz

Arizona

Meade

South Dakota

Lewis and Clark

Montana

Morton

North Dakota

Cascade

Montana

Tulare

California

Ward

North Dakota

Keith

Nebraska

Pima

Arizona

Mariposa

California

Douglas

Washington

Burleigh

North Dakota

Lake

Montana

Stutsman

North Dakota


Tuesday, March 22, 2022

K05

13:33 10% run on lambda

13:40 5% cval run on lambda

13:49 1% cval run


plots done. 


K03

12:35 10% run on lamba

 12:42, 5% run

12:53, 1% run


Monday, March 21, 2022

K01

Chose 1% critical value for plot, since the results are so good. Too good to be true? 


K02


K=4 amazing results


K06 run

Rt-workplace good results


Rt - T2m poor result


K08

K08 show good cointegration of Rt - workplace mobility, but not Rt- T2m


K17

19:17 10% run

19:21, 5% run

19:33, 1% run

19:50, generate table and plot


K15 run

K14 - K16 seem to have good co-integrated Rt-T2m.  


K20 run

K20, Rt-T2m trends weakens. It seems to peak at K14-16. So, I should try K15.

17:00 lambda 10% run, 17:10 done

17:23, 5% run done. 

17:31, 01% run. done

generate table and plots. Add limits=c(0, 0.6) to plots. 


K18 run

 16:00 lamba, 5% R code run. HQ could not find the output file. 

16:25, 10% run on lambda. 


K16 conintegration

It seems K=16 days is the optimal lag between Rt and T2m. 


K14 cointegration


auto_county_cajo_20200501-20210215-01percent-K14.R 


Sunday, March 20, 2022

15 month time window, no Rt-T2m rank of 2


I finished another cointegration analysis for 15 month year time window, 2020 May 1 - 2021 August 15. No rank of two is found for cajo Rt ~ T2m. So, either vaccination really alter the correlation, or second winter has to be included. 


Friday, March 18, 2022

cajo Rt - T2m pattern

 After filter adf p-value, NE cluster disappeared. Instead, Alaska and west coat are the new cluster. 

tb <- tb %>% filter( adf_p_Rt>0.01 & adf_p_t2m >0.05)


Thursday, March 17, 2022

2020May1-Sep1 covid19 peak analysis

 pwd: 

(base) hqin@CS313BQin _run-2020501-20200901 % pwd

/Users/hqin/github/COVID19_transmission_MS/_run-2020501-20200901


Rt ~ T2m is very strong!!!


In the summer, T2m are mostly non-stationary!!!


cajo, Carter, TN,

 Cater, TN

time window April 1 to September 1, 2020. 

adf.test(Rt) --> p-value <=0.01. !!!!


This means Rt is stationary and leads to numerical errors in further analysis. 


Saturday, March 12, 2022

two independent random walks, r=0 for Johansen test

 two independent random walks, r=0 for Johansen test

one random walk and one stationary series, r=1 for Johansen test.