Sunday, December 31, 2023

PULSE educ1* files

 The Household Pulse Survey (HPS) data files, classified based on the similarity of their column names and formats, can be summarized as follows:


1. **Files with Columns Related to Average Household Hours Spent on Various Educational Activities (Weeks 1 to 5)**:

   - Files: `educ1_week1.xlsx` to `educ1_week5.xlsx`

   - Columns: Average household hours spent on live virtual contact, teaching activities with children, and others.


2. **Files with Columns Focusing on Average Household Hours Spent by Children on Learning Activities (Weeks 6 to 12)**:

   - Files: `educ1_week6.xlsx` to `educ1_week12.xlsx`

   - Columns: Include additional focus on children's learning activities done on their own.


3. **Files with Columns on Time Spent on Learning Activities by Children in Public or Private School (Weeks 13 to 27)**:

   - Files: `educ1a_week13.xlsx` to `educ1a_week27.xlsx`

   - Columns: More detailed breakdown of time spent on learning activities.


4. **Files with Columns on Frequency of Live Contact with Teachers (Weeks 13 to 27)**:

   - Files: `educ1b_week13.xlsx` to `educ1b_week27.xlsx`

   - Columns: Focused on the frequency of live contact between students and teachers.


5. **Files with Columns Related to Various Modes of Learning Combination (Weeks 28 to 33)**:

   - Files: `educ1a_week28.xlsx` to `educ1a_week33.xlsx`

   - Columns: Address different combinations of in-person and other forms of learning.


6. **Files with Columns on Frequency of Children’s Real-Time Contact with Teachers (Weeks 28 to 33)**:

   - Files: `educ1b_week28.xlsx` to `educ1b_week33.xlsx`

   - Columns: Focus on real-time contact frequencies.


7. **Files with Columns on Attendance in Various Educational Programs (Weeks 34 to 39)**:

   - Files: `educ1a_week34.xlsx` to `educ1a_week39.xlsx`, `educ1b_week34.xlsx` to `educ1b_week39.xlsx`

   - Columns: Include types of educational programs attended.


8. **Files with Columns on Adult Household Members' Adjustments for Child Care (Weeks 40 to 48)**:

   - Files: `educ1_week40.xlsx` to `educ1_week48.xlsx`

   - Columns: Address how adults adjusted work and care responsibilities.


9. **Files with Columns on Various Child Care Arrangements (Weeks 49 to 54)**:

   - Files: `educ1_week49.xlsx` to `educ1_week54.xlsx`

   - Columns: Focused on different types of child care arrangements.


10. **Files with Similar Columns on Child Care Arrangements (Weeks 55 to 57)**:

   - Files: `educ1_week55.xlsx` to `educ1_week57.xlsx`

   - Columns: Similar to the previous group but with slight variations.


11. **Files with Columns on Children's Enrollment Status (Weeks 58 to 63)**:

   - Files: `educ1_week58.xlsx` to `educ1_week63.xlsx`

   - Columns: Focused on whether children are enrolled in public/private school or homeschooled.


This summary indicates the evolution and diversification of survey questions over different weeks, reflecting the changing focus and depth of inquiry into educational experiences during the COVID-19 pandemic.
Friday, December 29, 2023

NN SVG Neural nework architecture drawing


NN-SVG

Publication-ready NN-architecture schematics. Download SVG

neural network drawing 

https://alexlenail.me/NN-SVG/index.html


Monday, December 25, 2023

*** Journals related to quantitative biology, mathematic biology, computational biology, aging

Journals related to quantitative biology, mathematic biology, computational biology, aging

-> scientific reports

-> Patterns

-> ACM/IEEE bioinformatics


-> Springer, Bulletin of Mathematical Biology impact factor 2.0
http://www.springer.com/new+%26+forthcoming+titles+%28default%29/journal/11538

-> Mathematical Biosciences
E Voit (editor)


->eLife, computational biology, Chris Ponting

-> Elsiver Jounrnal of computational and applied mathematics, impact factor 1.1
http://www.journals.elsevier.com/journal-of-computational-and-applied-mathematics/

-> Springer, Journal of Mathematical biology, impact factor 2-3.

> Springer, Quantitative biology (not included in PubMed)
http://link.springer.com/journal/40484/2/1/page/1

>
http://en.wikipedia.org/wiki/List_of_mathematics_journals

>BMC systems biology, impact factor 3.1


>BMC Biology
http://www.biomedcentral.com/bmcbiol/about#publication

http://academia.stackexchange.com/questions/47/what-are-alternatives-to-journal-of-theoretical-biology

http://www.bio.vu.nl/nvtb/JournalsTB.html

->Aging cell, Impact factor 6 http://www.bioxbio.com/if/html/AGING-CELL.html
Open access, publication charge
http://onlinelibrary.wiley.com/journal/10.1111/%28ISSN%291474-9726/homepage/ForAuthors.html

-> Peer J

-> Journal of Aging Research. Gavirolv and Gavrilova's journal.


-> Journal of theoretic biology, impact factor 2.5 

Biology Open, BMC Biology, the four EMBO scientific publications, and the PLOS journals.

Genetics

Royal society transactions

Aging, New York
https://www.aging-us.com/editorial-board

FEMS Yeast
impact factor 2.4

Mechanism of aging and development, IF 3.2, http://www.medsciediting.com/sci/?fullname=mechanisms%20of%20aging%20%20development&action=search
Open access is a choice

Experimental gerontology, IF 3.9
http://www.bioxbio.com/if/html/EXP-GERONTOL.html


Eukaryotic cell, IF 3.6

HHMI journal

http://www.medsciediting.com/sci/?fullname=mechanisms%20of%20aging%20%20development&action=search

computational biology and bioinformatics research 
https://academicjournals.org/journal/JCBBR

IF 7.2
https://www.sciencedirect.com/journal/computational-and-structural-biotechnology-journal/about/aims-and-scope

IEEE BIBM 
https://web.cvent.com/event/cc0e2184-2d99-455d-80bb-41c43208970e/summary


Friday, December 22, 2023

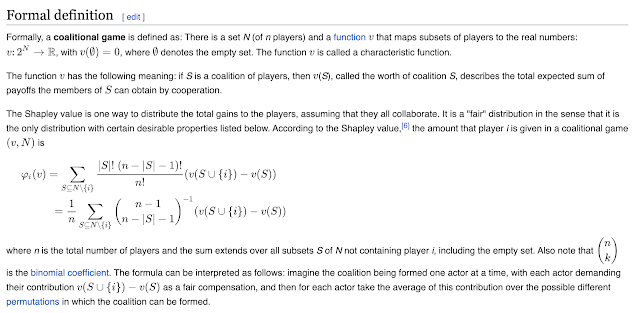
Shapely value, SHAP

from:   Shapley value - Wikipedia


Shapley Value (): This is the formula that calculates the contribution of player 's to the coalition. It ensures that each player's contribution to the total gain is acknowledged fairly. The value for player in the coalition is calculated by considering all subsets of players that do not include player and then taking into account how much player adds to each subset.

Terms in the Shapley Value Formula:

  • : The number of players in subset .
  • (1)!: Factorial of the number of players not in minus one.
  • !: Factorial of the number of players in .
  • !: Factorial of the total number of players.
  • ({})(): The marginal contribution of player to subset , which is the difference in the value of the coalition with and without player .
  • The summation extends over all subsets of that do not contain player , indicating that the Shapley value considers all possible ways a player can contribute to any coalition.

An alternative equivalent formula for the Shapley value is:

where the sum ranges over all  orders  of the players and  is the set of players in  which precede  in the order . Finally, it can also be expressed as

which can be interpreted as


SHapley Additive exPlanations (SHAP):

  • Origin: SHAP is a modern tool used in the field of machine learning, particularly in explainable AI, and was developed by Lundberg and Lee in 2017.
  • Purpose: SHAP is used to explain the output of machine learning models by attributing the prediction of each instance to the contributions of individual features.
  • Calculation: SHAP values are computed for each feature for each prediction, reflecting how much each feature contributed to the prediction relative to a baseline. It uses Shapley values to provide these explanations.
  • Properties: SHAP inherits the properties of Shapley values but applies them in the context of a predictive model. It ensures that feature attributions are consistent with the model output.
  • Practicality: Computing exact Shapley values for machine learning models can be extremely computationally expensive, especially for complex models with many features. SHAP introduces efficient algorithms and approximations to estimate Shapley values in a practical time frame.

In essence, SHAP adapts the concept of Shapley values to the domain of machine learning. While Shapley values were originally intended for human players in a coalition game, SHAP applies the same principles to the "players" of a machine learning model, which are the features used for making predictions. SHAP is particularly focused on providing local explanations, meaning it explains individual predictions with an additive feature attribution method that respects the Shapley value properties.

This makes SHAP a powerful tool for interpreting complex models, as it breaks down predictions into understandable contributions from each feature, allowing users to understand the decision-making process of the model, thereby increasing transparency and trust.


The SHAP base value, also known as the expected value, is a key component in SHAP (SHapley Additive exPlanations) values calculations. It represents the average prediction of the model over the training dataset12.

In other words, if you were to make a prediction without knowing any features, the best guess would be the base value. This is essentially the prediction that the model would make if it did not have any feature information available12.

For example, in a binary classification problem, the base value could be the log-odds of the average of the outcome variable in the training set1. In a regression problem, the base value could be the average of the target variable across all the records3.

It’s important to note that the base value can vary depending on the link function used. For instance, when using the identity link function, the base value is in the raw score space. If you wish to switch to the probability space, you would need to apply the appropriate transformation, such as the sigmoid function for logistic regression2.

In the context of SHAP values, the base value serves as the starting point for the allocation of feature contributions. Each feature’s SHAP value then represents how much that feature changes the prediction from the base value12.