Showing posts with label covid19. Show all posts

Sunday, February 12, 2023

COVID19 unified data


https://github.com/hongqin/COVID-19_Unified-Dataset

COVID19.csv contain the machine-readable data, that can be used for differential fitness analysis. 


Wednesday, January 25, 2023

covid 19 images


https://commons.wikimedia.org/wiki/File:IRAKOZE_SAMUEL_IN_HIS_WHEELCHAIR_TO_SCHOOL.jpg


Wednesday, January 18, 2023

Monday, January 2, 2023

biobot data


https://biobot.io/data/

https://github.com/biobotanalytics/covid19-wastewater-data


Friday, July 15, 2022

Species distribution models with BART


Species distribution models with BART

https://github.com/cjcarlson/embarcadero

Colin J. Carlson

Tuesday, July 12, 2022

predicting new viral variants


Flagship unwraps new AI biotech that looks to predict variants before they’re here


https://endpts.com/flagship-unwraps-new-ai-biotech-that-looks-to-predict-variants-before-theyre-here/


Monday, July 4, 2022

multinomial growth fitness model


https://assets.publishing.service.gov.uk/government/uploads/system/uploads/attachment_data/file/1086494/Technical-Briefing-43-28.06.22.pdf


Friday, July 1, 2022

BA substrain comparison

Using Qin's cumulative N ratio method 

BA.2 / BA.1, slope = 0.01464467


BA.4 / BA.2, slope = 0.02896763

BA.5 / BA.1

BA.4 / BA.1


Saturday, June 25, 2022

b1I1 / b2I2


[Previously saved workspace restored]


> b1 = 1

> b1 = 2

> b2= 1.8

> I1 = c(0.005, 0.5, 0.9)

> I2 = c(0.8, 0.5, 0.1)

> b1*I1 / b2 * I2

[1] 0.004444444 0.277777778 0.100000000

> ratio = b1*I1 / b2 * I2

> t = 1:3

> plot( ratio ~ t)

> t = 1:5

> t

[1] 1 2 3 4 5

> I1 = 0.005*2^5

> I1

[1] 0.16

> I1 = 0.005*2^t

> I1

[1] 0.01 0.02 0.04 0.08 0.16

> I2 = 1 - I1

> ratio = b1*I1 / b2 * I2

> plot( ratio ~ t)

> plot( log(ratio) ~ t)

Tuesday, June 21, 2022

GISAID VOC


df = pd.read_csv("variant_surveillance.tsv", sep = '\t',dtype = {'Variant': 'string','Is reference?': 'string'})

array(['Alpha', 'Beta', 'Delta', 'Epsilon', 'Eta', 'GH/490R', 'Gamma',
       'Iota', 'Kappa', 'Lambda', 'Mu', 'Omicron', 'Theta', 'Zeta'],
      dtype=object)

North America


Saturday, March 26, 2022

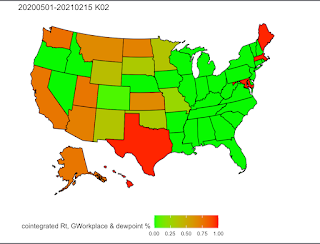
rerun with adf test on mobility

After filtering moblity on adf p-value, the number available mobility test are much smaller. 

On ECS323 Lambda server 
K02, 
18:28, auto_county_cajo_20200501-20210215-01percent-K02.R
18:33 auto_county_cajo_20200501-20210215-05percent-K02.R
18:39 auto_county_cajo_20200501-20210215-10percent-K02.R
19:02 K02, summary and plot udpated. Similar figures. 

K03
19:20.  auto_county_cajo_20200501-20210215-01percent-K03.R
19:27 auto_county_cajo_20200501-20210215-05percent-K03.R
19:32, auto_county_cajo_20200501-20210215-10percent-K03.R

K04
19:42 auto_county_cajo_20200501-20210215-01percent-K04.R
19:47 auto_county_cajo_20200501-20210215-05percent-K04.R
19:52 auto_county_cajo_20200501-20210215-10percent-K04.R

K05
20:15 auto_county_cajo_20200501-20210215-01percent-K05.R
20:32 auto_county_cajo_20200501-20210215-05percent-K05.R
20:44 auto_county_cajo_20200501-20210215-10percent-K05.R

K06
20:56 auto_county_cajo_20200501-20210215-01percent-K06.R
21:05 auto_county_cajo_20200501-20210215-05percent-K06.R
21:11 auto_county_cajo_20200501-20210215-10percent-K06.R

21:42, Redo all plots, 

21:43 - 23:11, Rmd to generate summary table based  cval=1% cajo test. There was an index error to find out the appropriate numerators. It should be chr '2' or chr '3', not integer 2 or 3. This is a very tricky error. 


Tuesday, March 22, 2022

K05

13:33 10% run on lambda

13:40 5% cval run on lambda

13:49 1% cval run


plots done. 


K03

12:35 10% run on lamba

 12:42, 5% run

12:53, 1% run