Saturday, March 12, 2022

Augmented Dickey–Fuller test

null H0: unit root is present in a time series sample, ie non-stationary. 
alternative H1: stationary. 

Stationary means that the characteristic is not changing over time. 


Reference: 
https://en.wikipedia.org/wiki/Augmented_Dickey%E2%80%93Fuller_test
https://en.wikipedia.org/wiki/Stationary_process

two independent random walks, r=0 for Johansen test

 two independent random walks, r=0 for Johansen test

one random walk and one stationary series, r=1 for Johansen test. 


*** update cajo with new interpretation of rank r

HQ realized that rank=2 for two variable is actually a good combination.  

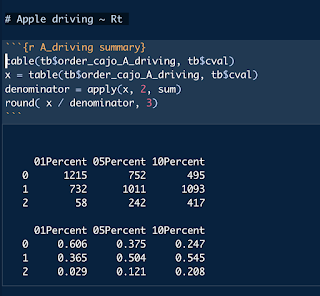
Moderate cointegration of Rt and Apple driving. 


Northern states are more likely to have Rt ~ T2m


Confirmed by Rt, T2m, Apple-driving


21:30. HQ added adf.test and found many small p-value for T2m, dewpoint and even Rt. Small p-value of ADF-test means alternative hypothesis cannot be rejected.  This means dewpoint are mostly stationary. 

> adftest
Augmented Dickey-Fuller Test
data:  x_nona[, 1]
Dickey-Fuller = -5.2384, Lag order = 5, p-value = 0.01
alternative hypothesis: stationary


Friday, March 11, 2022

cajo results summary for publication, error found!


working code:   _generate_tables_for_publication.Rmd

10% critical value


Rt ~T2m 


# 35.6% counties has positive ca.jo Rt ~ T2m at 10% critical value, 28.2% at 5%, and 14.9% at 1% critical value. 


cajo Rt - Apple driving


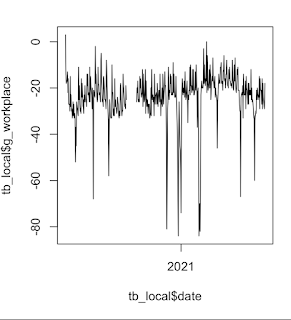
cajo Rt - google workplace 

# cajo Rt, Apple driving, T2m


ERROR DISCOVERed. 

Based on https://www.quantstart.com/articles/Johansen-Test-for-Cointegrating-Time-Series-Analysis-in-R/,  when three time series are used, r = 3 means three time series are needed to generate a stationary series!!! 

So, its seems eigen values can be used to evaluate the combination of time series for stationary combinations. 


Thursday, March 10, 2022

how to view smime.p7m


a digital signature

https://comodosslstore.com/resources/what-is-an-smime-p7s-file-attachment-and-how-do-i-open-it/

ca.jo 1% 5% critical value output

 running codes: 

auto_county_cajo_20200915-20210215-5percent.R

auto_county_cajo_20200915-20210215-1percent.R


output files: 

(base) hqin@CS313BQin COVID19_transmission_MS % ls _run-20200915-20210215/*csv

_run-20200915-20210215/_autocajo_1-3151:2020-09-15-to-2021-02-15-cval-1percent.csv

_run-20200915-20210215/_autocajo_1-3151:2020-09-15-to-2021-02-15-cval-5percent.csv

get_cajo_rank ()

There was a typo in a variable name, which took 2-3 hours to fix. 


# Function to get cajo test rank

get_cajo_rank = function( in_system, in_K= 12, in_cval_index=3, in_max_cajo_order=1  ) {

    tryCatch ( 

      {   test_tmp = ca.jo(in_system, type='trace', ecdet = 'const', K= in_K)

          ratio_test_cvalPer = test_tmp@teststat / test_tmp@cval[,in_cval_index]  #ratio of test statistics vs critical values

          number_of_positive_tests = table( ratio_test_cvalPer > 1)['TRUE'] #return the number of TRUE, which can > max_cajo_order

          output_rank = min( number_of_positive_tests,  in_max_cajo_order ) # make sure max_cajo_order is the up limit

          print(paste("get_cajo_rank():: output_rank = ", output_rank))

          return(output_rank)   

      },

      error=function(error_message) {

          output_rank = -999 # an error code

          return(output_rank)   

      })

}


Wednesday, March 9, 2022

CPSC4900 Ch6, micro-service, part 2 Q11--, college tech symposium pre-registraion


== In-class to do: 

For ECS Room 220, podium computer use channel 4 in Extron controller. 

restart computer to make sure ZOOM works. make sure Bluetooth mouse are turned off. 

clean up desktop space, calendars: 

ZOOM, live transcript (start video recording).  Turn the computer speaker on. 

* college tech symposium pre-registraion, title, team members, faculty name and course number, poster. Let students work in class to pre-registrate. 

* Start Ch6 socrative, went through Q11 ----last question. Next time, start with Ch7. 

Observation: Based on Team Sprint plans, each team chose a different style of Spring Plan. This seems to set the team culture. 


cajo on 2020-2021 winter peak

 based on the Baker science paper, first wave is tsunami, second wave may be seasonal. 

11:40 run on lambda. 

ls

auto_county_cajo_2020-2021-winter.R  key_output  _nohup_winter_peak_lambda.txt

(base) hqin@ECS323Lambda:~/COVID19_transmission_MS/_run-2020-2021-winter-peak$ nohup R -f auto_county_cajo_2020-2021-winter.R > _nohup_winter_peak_lambda.txt &

[1] 72501

This run very fast

5pm. Went through output '_autocajo_1-3151/2020-09-01-to-2021-05-01. csv', and found many counties do not have no google  mobility values. 

All counties of Louisiana has NA google mobility. This might be a bug in my code. TODO 


So, I need to redo analysis with Rt- t2m, Rt-dewpoint, Rt ~A_driving. 


Tuesday, March 8, 2022

cajo Rt, gworkplace, t2m, ridgeside

 add Rt ~ mobility + weather test result to batch output. 

16:15, debug passed, 


16:50, execute the R code on ridgeside. 

17:51 Run three parallel R codes: 
(r2021nov) hqin@ridgeside:~/github/COVID19_transmission_MS$  
(r2021nov) hqin@ridgeside:~/github/COVID19_transmission_MS$ ps -ef | grep cajo
hqin      3938 23753 95 17:49 pts/3    00:00:33 /home/hqin/.conda/envs/r2021nov/lib/R/bin/exec/R -f auto_count_cajo_noargs-1K-2K.R
hqin      6046  2716 99 16:51 pts/0    01:37:38 /home/hqin/.conda/envs/r2021nov/lib/R/bin/exec/R -f auto_county_cajo_noargs.R
hqin     23702 23753  0 17:49 pts/3    00:00:00 grep cajo
hqin     30165 23753 99 17:49 pts/3    00:00:07 /home/hqin/.conda/envs/r2021nov/lib/R/bin/exec/R -f auto_count_cajo_noargs-2K-3151.R
hqin     31881 23753 99 17:48 pts/3    00:09:55 /home/hqin/.conda/envs/r2021nov/lib/R/bin/exec/R -f auto_count_cajo_noargs-1-1000.R


So, some counties in 1-1000 rows are taking a very long time. 

Next day, 2022-03-09, 15:11, The 1-1000 chunk R codes is still running after 22 hours. So, I need to find out the bottleneck, and output file piecewise. 

(r2021nov) hqin@ridgeside:~/github/COVID19_transmission_MS$ ps -ef | grep count
root       848     1  0 Mar03 ?        00:00:07 /usr/lib/accountsservice/accounts-daemon
hqin      6046  2716 99 Mar08 pts/0    23:09:38 /home/hqin/.conda/envs/r2021nov/lib/R/bin/exec/R -f auto_county_cajo_noargs.R
hqin     12325 23753  0 15:21 pts/3    00:00:00 grep count
hqin     31881 23753 99 Mar08 pts/3    21:51:50 /home/hqin/.conda/envs/r2021nov/lib/R/bin/exec/R -f auto_count_cajo_noargs-1-1000.R


So, I kill 31811 job.

Revised the R code to output file step by step. 

Surprisingly, this time the code finished shortly. 
(r2021nov) hqin@ridgeside:~/github/COVID19_transmission_MS$ ls -lth *csv  
-rw-r--r-- 1 hqin simctr 175K Mar  9 15:52 _autocajo_ridgeside1-1000:2020-03-15-to-2021-08-01.csv

So, the problem is stochastic. So, I killed the long-running job. 

synced the running results to github. 

done. 


Sunday, March 6, 2022

cajo debug

/Users/hqin/github/COVID19_transmission_MS

14:40  bug found. There are two dataframes, location and report, but with different rows. Correct the bug with using report consistently. 

bug found when cajo. Rt ~ g_workplace

Hardeman

Tennessee

47069

35.2077202

-88.991612

TRUE

TRUE

date::era5_t2m::era5_dewpoint::dailyCases::Rt::A_driving::g_retail::g_grocery::g_parks::g_transit::g_workplace::g_residential

2


There are only 2 variable, how did rank of 2 returned? 


Eigenvalues (lambda):

[1] 0.06519351 0.04638336 0.00000000


Values of teststatistic and critical values of test:


          test 10pct  5pct  1pct

r <= 1 | 21.51  7.52  9.24 12.97

r = 0  | 52.05 17.85 19.96 24.60

So, the return is correct numerically. 


report$order_cajo_gworkplace[i] = table( ratio_test_cval1Per > 1)['TRUE'] #return the number of TRUE, which 

                                                                                    # give 2 sometimes for 1 pair ca.jo test


HQ spent two hours on finding and fixing the cajo error. 
TODO: convert Rmd into R file. 


Friday, March 4, 2022

math + data = impact


have the courage to take your own thoughts seriously. 


Tim Chartier, Davidson College. 

Thursday, March 3, 2022

Prevent GoogleDrive and Onedrive overrun on Mac


turn off Spotlight search for GoogleDrive and OneDrive


In settings, locate "Spotlight", then add Google Drive and OneDrive directories into "privacy". 


Referece: 

https://support.google.com/drive/thread/138478469/macos-google-drive-desktop-constantly-high-cpu-load-%E2%9E%9C-fan-noise?hl=en-GB


CPSC4900 ESP Ch6 microservice architecture, part 1


== In-class to do: 

For ECS Room 220, podium computer use channel 4 in Extron controller. 

restart computer to make sure ZOOM works. make sure Bluetooth mouse are turned off. 

clean up desktop space, calendars: 

ZOOM, live transcript (start video recording).  Turn the computer speaker on. 

* Start Ch6 socrative, went through Q1-10. 

11:15-> let teams work on projects. 

Observation: Based on Team Sprint plans, each team chose a different style of Spring Plan. This seems to set the team culture. 


Tuesday, March 1, 2022

cpsc4900 Ch5, part 2

  == pre-class to do: 

calendar email invitation: including guests;  NA 

socrative questions.  done

update Canvas course materials, update learning objectives. assignments as needed.   NA

* make sure grades are NOT shown on Canvas. 

 learning objectives:  ??

== In-class to do: 

For ECS Room 220, podium computer use channel 4 in Extron controller. 

restart computer to make sure ZOOM works. make sure Bluetooth mouse are turned off. 

clean up desktop space, calendars: 

ZOOM, live transcript (start video recording).  Turn the computer speaker on. 

* socrative, Ch5. start at "Q 16" - finished Ch5in 30 minutes. 

*go over team project, let student work on Product backlog and Spring 1 plan.