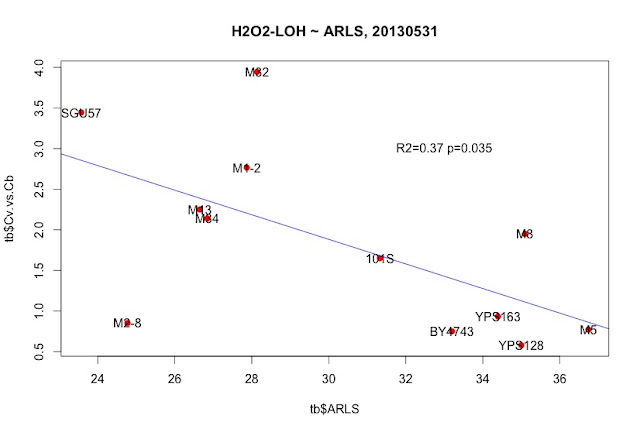
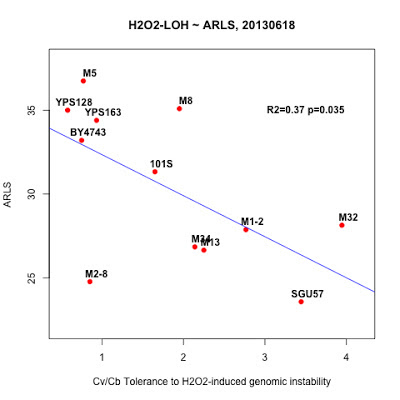
"_2013May29,R0-G-TcTg.regression.by.mean.R" in /Users/hongqin/projects/LOH_H2O2_2012-master/analysis. The ARLS data is from Qin06EXG.
rm( list = ls() );
tb = read.table("summary.new.by.strain.csv", header=T, sep="\t");
tb.old = tb;
labels = names( tb.old );
#tb = tb.old[c(1:11), c(1:5,8, 10, 12, 14, 16, 18, 20, 22)]
tb = tb.old[c(1:11), c("strain","ARLS","R0","G","CLS","Tc", "Tg","Tmmax","Tbmax", "Td", "Tdmax","TLmax","Lmax",
"b.max", "b.min", "strains", "L0.all", "L0.small" , "Pbt0","Pb0.5t0", "Pbt0.b") ];
tb$CLS.vs.Tc = tb$CLS / tb$Tc;
tb$Tg.vs.Tc = tb$Tg / tb$Tc;
tb$Tc.vs.Tg = tb$Tc / tb$Tg
> summary( lm( tb$Tc.vs.Tg ~ log(tb$R0) + tb$G ) )
Call:
lm(formula = tb$Tc.vs.Tg ~ log(tb$R0) + tb$G)
Residuals:
Min 1Q Median 3Q Max
-0.16512 -0.04416 -0.01631 0.03805 0.22175
Coefficients:
Estimate Std. Error t value Pr(>|t|)
(Intercept) 1.58691 0.31955 4.966 0.00110 **
log(tb$R0) 0.22037 0.06505 3.388 0.00953 **
tb$G 4.68078 1.68987 2.770 0.02430 *
---
Signif. codes: 0 ‘***’ 0.001 ‘**’ 0.01 ‘*’ 0.05 ‘.’ 0.1 ‘ ’ 1
Residual standard error: 0.1101 on 8 degrees of freedom
Multiple R-squared: 0.5991, Adjusted R-squared: 0.4989
F-statistic: 5.977 on 2 and 8 DF, p-value: 0.02584
require(scatterplot3d);
s3d <- scatterplot3d( log(tb$R0), tb$G, tb$Tc.vs.Tg, type='h',color="red", pch=16,
main="Correlations among Tc/Tg, log(R0), and G",
angle=40, scale.y=0.7
);
my.lm <- lm( tb$Tc.vs.Tg ~ log(tb$R0) + tb$G);
s3d$plane3d( my.lm, lty.box="solid");
text(s3d$xyz.convert( tb$Tc.vs.Tg, log(tb$R0), tb$G), labels=tb$strain, pos=1)
> model = lm(log(tb$R0) ~ tb$G )
> summary( model ) #p=0.02, strehler-mildvan correlation!
Call:
lm(formula = log(tb$R0) ~ tb$G)
Residuals:
Min 1Q Median 3Q Max
-0.86676 -0.45345 -0.04328 0.40139 0.80255
Coefficients:
Estimate Std. Error t value Pr(>|t|)
(Intercept) -4.2158 0.8407 -5.015 0.000724 ***
tb$G -17.2886 6.4637 -2.675 0.025425 *
---
Signif. codes: 0 ‘***’ 0.001 ‘**’ 0.01 ‘*’ 0.05 ‘.’ 0.1 ‘ ’ 1
Residual standard error: 0.5641 on 9 degrees of freedom
Multiple R-squared: 0.4429, Adjusted R-squared: 0.381
F-statistic: 7.154 on 1 and 9 DF, p-value: 0.02543
> plot( log(tb$R0) ~ tb$G, pch=19, ylim=c(-8, -5), xlim=c(0.07, 0.17) )
> title("p=0.025, Strehler-Mildvan, natural isoaltes")
> text( tb$G*1.01, log(tb$R0)*1.02, tb$strain)
> abline(model, col='red')
> tb
strain ARLS R0 G CLS Tc Tg Tmmax Tbmax Td Tdmax TLmax Lmax b.max
1 101S 31.32761 0.0012098 0.1421899 3.393531 4.580000 5.686667 5.483333 5.633333 4.786667 4.786667 6.653333 2.4900000 0.04333333
2 M1-2 27.86968 0.0024437 0.1283620 10.370586 6.273333 6.930000 7.316667 6.833333 6.930000 6.930000 7.653333 0.7066667 0.04000000
3 M13 26.65020 0.0029551 0.1252717 16.273320 8.010000 11.053333 9.433333 11.083333 9.246667 9.246667 9.666667 0.6533333 0.13666667
4 M14 36.58444 0.0018812 0.0949553 7.212224 3.960000 7.043333 4.900000 7.016667 5.840000 5.840000 9.500000 1.2000000 0.16333333
5 M2-8 24.77079 0.0041838 0.1193465 4.124016 4.122500 4.507500 5.100000 4.487500 5.870000 5.870000 7.020000 3.3450000 0.03425000
6 M32 28.13750 0.0017568 0.1417765 6.422428 7.963333 7.413333 9.733333 7.350000 8.206667 8.206667 7.626667 0.5966667 0.03000000
7 M34 26.84275 0.0012919 0.1629953 5.167521 6.732500 8.212500 8.325000 8.300000 8.382500 8.382500 7.552500 0.7925000 0.22250000
8 M5 36.74289 0.0040310 0.0681621 4.934625 5.920000 7.816667 7.050000 7.833333 6.546667 6.546667 6.906667 1.8400000 0.24333333
9 M8 35.09139 0.0003775 0.1619232 10.492830 6.783333 11.466667 8.216667 11.516667 6.026667 6.026667 6.873333 1.2400000 0.16666667
10 YPS128 34.99853 0.0011183 0.1209893 3.309616 8.630000 12.873333 10.750000 12.450000 11.420000 11.420000 11.766667 1.7333333 0.20666667
11 YPS163 34.39308 0.0008251 0.1350900 4.184502 5.246667 8.310000 6.850000 8.283333 7.140000 7.140000 5.246667 1.3266667 0.16333333
b.min strains L0.all L0.small Pbt0 Pb0.5t0 Pbt0.b CLS.vs.Tc Tg.vs.Tc Tc.vs.Tg
1 0.00000000 101S 0.15957447 0.09523810 0.00280093 0.00026676 0.00277755 0.7409457 1.2416303 0.8053927
2 0.00000000 M1-2 0.06164384 0.03571429 0.00183932 0.00006569 0.00189366 1.6531221 1.1046759 0.9052429
3 0.00000000 M13 0.09345794 0.12500000 0.00197697 0.00024712 0.00214845 2.0316255 1.3799417 0.7246683
4 0.00333333 M14 0.11224490 0.10975610 0.00699718 0.00076798 0.00660394 1.8212687 1.7786195 0.5622338
5 0.00000000 M2-8 0.14859438 0.16363636 0.00366569 0.00059984 0.00390693 1.0003677 1.0933899 0.9145868
6 0.01000000 M32 0.10962567 0.13440860 0.01235470 0.00166058 0.01252386 0.8065000 0.9309334 1.0741906
7 0.00250000 M34 0.17134831 0.16176471 0.00727065 0.00117614 0.00688487 0.7675486 1.2198292 0.8197869
8 0.00000000 M5 0.17187500 0.17948718 0.00200535 0.00035993 0.00206424 0.8335515 1.3203829 0.7573561
9 0.00000000 M8 0.05810398 0.07471264 0.00637153 0.00047603 0.00633754 1.5468545 1.6904177 0.5915698
10 0.01333333 YPS128 0.18353175 0.09166667 0.01086710 0.00099615 0.01106367 0.3835013 1.4916956 0.6703780
11 0.00666667 YPS163 0.25268817 0.09032258 0.00712283 0.00064335 0.00824009 0.7975545 1.5838628 0.6313678


