Saturday, May 18, 2013

optim() usage in R.


optim(par, fn, gr = NULL, ...,
      method = c("Nelder-Mead", "BFGS", "CG", "L-BFGS-B", "SANN", "Brent"),
      lower = -Inf, upper = Inf,
      control = list(), hessian = FALSE) 
 
'par' is the default parameter for 'fn'.
Additional parameters for 'fn' can be passed on by specifying them after 'fn', such as
optim( par=c(0.05, 0.1), fn=llh, lifespan=current_lifespan)

Reference:
http://www.biostat.umn.edu/~ph7440/pubh7440/OptimLinearModel.R

Sunday, May 12, 2013

MSH2 project problems in BIO125, Spring 2013

In BIO125 Spring of 2013, we had three major problems:

1) The 5FOA assays gave opposite results 
 Functional assay of MSH2 and its mutants on 5FOA plates gave results that were opposite to expectations: Wildtype MSH2 transformants gave the largest number of colonies, pRS413 vector control (msh2Delta) gave the least number of colonies. The yeast strains for these assays were the pre-transformed yeast strains shipped directly from our collaborator, partly because students' transformation did not use -URA selection for the reporter marker, partly because we thought the pre-transformed yeast should work. It seems that the wildtype and vector control (msh2Delta) were somehow mixed up. 


Cell concentrations in the three samples are based on OD600. All three strains were grown only overnight, and their OD values are so low that we had to spin them down and concentrate them. We then diluted the samples to similar OD600 and spotted them on 5FOA plates. Ideally, the wildtype MSH2 should give the least number of colonies on 5FOA, because its low mutation rate in the micro-satellite region of the URA-reporter gene. The vector control should have the higher number of colonies than the wildtype MSH2, but unfortunately not.

Possible ways to address this problem: 
Redo transformation with the proper -URA selection.

2014 Feb 10: URA3-reporter is under LEU promoter that are activated in -LEU-Thr conditions.


2) Reporter strain  showed the same band with wildtype MSH2 by PCR 
Dr. Steve Kiokio performed PCR using our MSH2 primers, and saw the expected bands in the reporter strain. It is possible that MSH2 mutation in the reporter strain is not a full-gene deletion, and our primers simply amplified the region still remained in the truncated MSH2 on the chromosome. 

Possible ways to address this problem: Redesign PCR primers, seek advice from original authors.
The primers  BIO125 used to amplify a 845bp fragment of MSH2 in the coding region are:
MSH2FOR 1395 5' CAA ATT CGA AGA AAT GGT TG 3' 1414
                            or CAAATTCGAAGAAATGGTTG
MSH2REV 2239 5' CAA CCA TAA ATG TGG AAA CAC C 3'
                            or  CAACCATAAATGTGGAAACACC
This pair primer has very low annealing temperature, and gave non-specific bands.
Our laboratory instructor, Dr. Kioko extended these primer to raise their annealing temperatures, but he obtained the same results.
The new primers are:
MSH2F 5'T GTC CAA ATT CGA AGA AAT GGT TG3'
          or  TGTCCAAATTCGAAGAAATGGTTG
MSH2R 5'T CAA CCA TAA ATG TGG AAA CAC C3'
          or  TCAACCATAAATGTGGAAACACC


Possible ways to address this problem: 
Contact the author for their PCR primers and ask for MSH2 deletion details. 

2014 Feb, endogenous MSH2 was disabled by disrupting of its promoter.


3) Western blot of total protein isolation did not work. 
 Pull-down of whole cell lysate  by HA antibody did not show any bands in western-blot. We suspect that MSH2 protein are trapped in the nuclear in the lysate, and may be thrown mostly thrown away in the precipitated portion.

Possible ways to address this problem:
Revise protein isolation protocol. Seek advice from the original authors.


Saturday, May 11, 2013

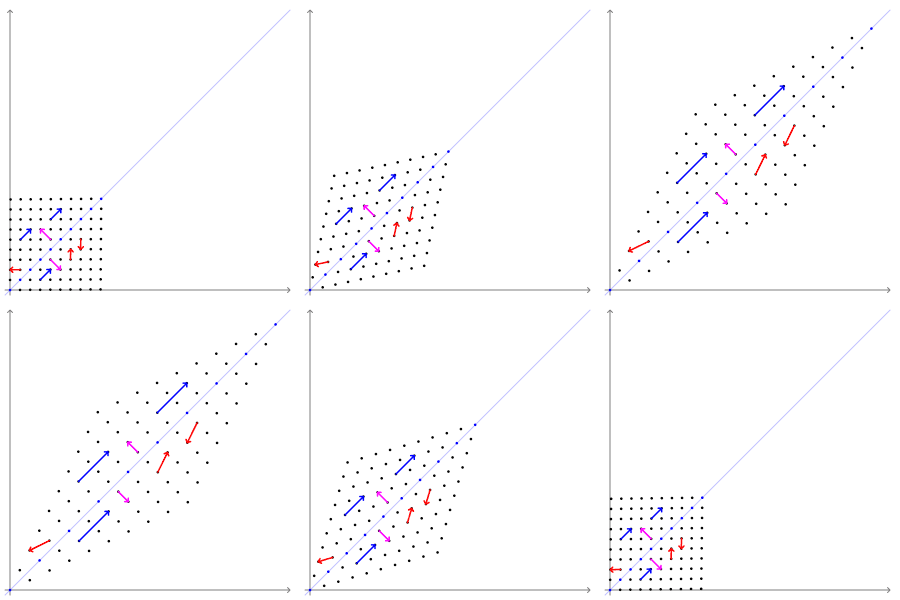
Visual interpretation of eigen vectors

Based on Wikipedia's entry on eigen vectors, Av=kv means the matrix A transformation will preserve the directionality along  eigen vectors v. The largest eigen value indicates the strongest transformation along that eigen vector.


The transformation matrix \bigl[ \begin{smallmatrix} 2 & 1\\ 1 & 2 \end{smallmatrix} \bigr] preserves the direction of vectors parallel to \bigl( \begin{smallmatrix} 1 \\ 1 \end{smallmatrix} \bigr) (in blue) and \bigl( \begin{smallmatrix} 1 \\ -1 \end{smallmatrix} \bigr) (in violet). The points that lie on the line through the origin, parallel to an eigenvector, remain on the line after the transformation. The vectors in red are not eigenvectors, therefore their direction is altered by the transformation. Notice that the blue vectors are scaled by a factor of 3. This is their associated eigenvalue. The violet vectors are not scaled, so their eigenvalue is 1.


Source: http://upload.wikimedia.org/wikipedia/commons/0/06/Eigenvectors.gif

A Youtube demo is also helpful: http://www.youtube.com/watch?v=wXCRcnbCsJA

Thursday, May 9, 2013

Periodical cicadas and birds, student math modeling project

Student math modeling project:

This idea is based on Carl Zimmer's NY Time's writing:
http://www.nytimes.com/2013/05/14/science/marvels-and-a-few-mysteries-in-cicadas-17-years.html?ref=science&_r=0

This oscillation can be done by modifying the predator-prety model with synchronization mechanisms.

Wednesday, May 8, 2013

Notes on Beach 13, a modular network for longevity in chronologically aging yeast

Beach et al, 2013 Cell Biol: Res Ther, 2:1. A modular network regulates longevity in chronologically aging yeast.

The Titorenko group found that ATP levels are similar between non-CR and CR yeast.

The proposed longevity module includes:
Trehalose and glycogen metabolism.
Glyccolysis, glucose fermentation to ethanol, gluconeogenesis.
Lipid metabolism in the ER, lipid bodies, and peroxisomes.
Interorganellar metabolic flow
ROS homeostasis
Oxidation-reductation reactions in mitochondria
Protection of mitochondrial DNA from damage
Maintenance of the mitochondrial network.


Tuesday, May 7, 2013

Notes on Gebre12, Osh6 overexpression extends yeast replicative lifespan

Gebre et al 2012, Cell Cycle, OSH6 overexpression extends yeast lifespan.  Paper from Fusheng Tang's group.

There 7 oxysterol binding proteins in yeast. Deletion of OSH5 and OSH6 upregulated mRNAs of ERG8 and ERG9. Overexpression OSH6 down-regulate total cellular sterol levels.

So, I figure that normal function of OSH6 should inhibits ERG9. Because ergosterol reduce membrane fluidity, so OSH6 normally increase membrane fluidity.
                 OSH6 ---| ERG9 ---| membrane fluidity ---> lifespan
This scheme is consistent with Gebre12's observation that over-expression of OSH6 can rescue vacuole fragmentation. Because over-expression of OSH6 extend lifespan, so its normal function should also 'extend' lifespan (similar to overexpression effect of SIR2). This seems to suggest that membrane fluidity is good for replicative lifespan, and it seems to make sense that more fluid cell membrane lead to more buddings.

Gebre12 used the ERG6 promoter to over-express OSH6,  OSH5, and perhaps other OSH genes. 

Question: OSH6 and OSH7 are paralogs, based on SGD. Gebre12 stated that they screened OSH genes and found OSH6 when overexpressed can complement vacuole fragmentation. How about OSH7?

Another question: How does ergosterol influence cellular membrane? Because ergosterol is the cholesterol in yeast, ergosterol should improve the rigidity of cellular membrane.
 Quote from Wikipedia on Cholesterol:
Cholesterol is required to build and maintain membranes; it modulates membrane fluidity over the range of physiological temperatures. The hydroxyl group on cholesterol interacts with the polar head groups of the membrane phospholipids and sphingolipids, while the bulky steroid and the hydrocarbon chain are embedded in the membrane, alongside the nonpolar fatty-acid chain of the other lipids. Through the interaction with the phospholipid fatty-acid chains, cholesterol increases membrane packing, which reduces membrane fluidity.[11] The structure of the tetracyclic ring of cholesterol contributes to the decreased fluidity of the cell membrane as the molecule is in a trans conformation making all but the side chain of cholesterol rigid and planar.[12] In this structural role, cholesterol reduces the permeability of the plasma membrane to neutral solutes,[13] protons, (positive hydrogen ions) and sodium ions.[14]
Question: Do overexpression of other OSH genes have no effect on lifespan? They probably did not extend lifespan, and only PERG6-OSH6 extend lifespan.

Figure2 provides survival curves of WT,  PERG6-OSH6, and PERG6-OSH5.  All 3 survival curves seems to have simliar Gompertz coefficient but different initial mortality rates. When different domains are chopped off from OSH6, the Gompertz coefficients of survivals are changed (Figure 3B). 

Interestingly, PERG-OSH6 is sensitive to rapamycin, and can not only abolish the lifespan extension effect of tor1Delta, but even reverse the effect of tor1Delta (Figure 6A and 6B).


Notes on Hou et al 12, systems biology of aging.

Hou et al 2012, systems biology of aging, Current Genomics, vol 13, No 7, p 561

Hou12 reviewed network-based approach to infer change during aging. Hou12 observed that subnework modules with correlated transcriptional changes during aging.  One concern that I have is that microarray are measured for survived cells, and those dead cells cannot be measured. So, the observed changes are not "causes" of aging, but consequences of selection during aging.

Notes on Dhahbi 02 PNAS Calorie restriction in mice

Dhahbi et al, 2002, PNAS, temporal linkage between the phenotypic and genomic responses to caloric restriction.

Fig 1. Survival curve between control and CR groups seem to suggest that CR has a sharper transition (large Gompertz coefficient), and smaller initial mortality rate, too. This seems to suggest a mix-population.

Dhahbi02 found at CR has an immediate effect on mortality rate, carcinogenesis, and genomic responses.


Qin, thoughts on network aging modeling (in progress)


Decaying of essential module over time can be modeled as Markov transition, and eigen value and vectors are likely to be useful for approximation.(see Sengupta02).

Cascading model of aging in network is similar to network percolation or difussion process.

Average lifespan is probably realted to the threshold of connection, and this relationship may be different in Poission and power-law networks.

Using essential gene to model lethality was used in Sengupta, et al 2002, PNAS, Specificity and robustness in transcription control networks. Sengupta02 modeled how mutation can change TF binding sites which can lead to lethality.

For 'compensation law of mortality' to be observed, Gavrilov91 argues for varying numbers of components per blocks, and unchanged component decaying rates and chance of component be functional.  These probably can be relaxed, and I can test this by simulations.

Simulation shows that change of n leads to perfect lnR ~ G, just as GG01 argued. Maybe power-law network leads to more robust lnR ~ G ?!

In general, expected mortality rate (hazard rate) of the network is the weighted average of the module mortality rates.  See http://hongqinlab.blogspot.com/2013/06/power-law-network-and-aging.html

Stochastic network model of aging leads to heterogenous individuals in populations. This idea of heterogeneity is also reflected in Vaupel's frailty model that aims to capture heterogeneity in populations. See Vaupel, Manton, and Stallard 1979.  Frailty=1 indicates 'standard' individuals. Frailty =2 indicates twice likely to die than standards. Vaupel tends to model frailty using a gamma distribution with mean =1 and \sigmma^2 as variance.


References:
http://user.demogr.mpg.de/jwv/cgi-bin/publications.plx?s=4


Notes on network analysis (in progress)

Average path length ~ log(number of nodes) / log(average degree)
     See Erdos-Renyi 59, Moon and Moser 66, Bollobas 81, Chung and Lu 01, Jackson 08

Power of adjancency matrix

Centrality through eigenvector

References:
 Mathew Jackson, Coursera course on social and economical networks.

Monday, May 6, 2013

Notes on Tang 08 Autophagy, a lifespan extending form of autophagy

Tang et al 2008, Autophagy, A lifespan extending form of autophagy

The study focuses on Atg15, a lipase required for intravacuolar lysis of autophagic bodies and Cvt bodies. Atg15 is located in ER and transported to vacuoles for break down membranes of autophagic bodies.

The known major forms of autophagy include: macroauthophagy, microauthophagy, and chaperone-mediated autophagy.  Tang08 argues for an fusion of vauoles with ER vesciles, termed secretophagy, based on Atg 15.  Tang08 found that Atg15 is the only autophagy protein that is critical for CR-mediated lifespan extension (Table 1 in Tang08), in the sense that only atgD did not show CR RLS extension effect.

Tang08's table 2 listed RLS under YEPD and CR media (0.5% glucose) for BY4742 (wild type), atg17D, atg10D, vam7D, ypt7D, nyv1D, erg2D-petite (?), erg3D, erg5D, erg6D, erg28D, sur4D, lcb4D, lcb5D, atg11D, vac17D, tco89D, nvj1D.

Interestingly,  CR significantly shorten RLS in ypt7D, nyv1D, and erg6D.  In figure 4, Tang08 showed that CR exacerbates vacuolar defects in erg6D cells.

My own data showed that nvj1D (?need to double-check this) can extend replicative lifespan. 

The pleiotropic role of lysosome-like vacuole in intracellular renewal/repairs mechanisms suggests its role on cellular robustness, which can be detected by Gompertz coefficient based on my network model of cellular aging. The robustness may also be experimentally measured by GFP, DHR, and DHE staining, cellular morphologies etc.  I wonder whether the number of genes involved are good enough for regression based analysis of Gompert coefficient and other measures.


Wednesday, May 1, 2013

TOR, rapamycin, Michale Xie's work


Xie MW, et al.  (2005) Insights into TOR function and rapamycin response: chemical genomic profiling by using 

Examples of Gompertz modeling in cells


Red blood cells, photohemolysis
M. Al-Akhras, A new application of Gompertz function in photohemolysis: the effect of temperature on red blook cell hemolysis phtosensitized by protoporthyrin IX, Med Bio, Eng Comput. 2006, 44:703-710.  Figures are plotted as percentage of dead cells ~ time, i.e., 1-viability ~ time.

E coli growth

Kim S, Nishioka M, Taya M (2004) Promoted proliferation of an SOD-deficient mutant of Escherichia coli under oxidative stress induced by photo excited TiO2. FEMS Microbiol
Lett 236:109–114


Kim et al. used Gompertz function for the growth of Escherichia coli under oxidative stress induced by photoexcited TiO2. 


Useful Latex templates and tips

Draw and look for latex symbols
http://detexify.kirelabs.org/classify.html


http://www.plosone.org/static/latexGuidelines


Two column article with PDF figures
http://embedded.eecs.berkeley.edu/concurrency/latex/latexWithPDF.html

Latex template galleries
http://tex.stackexchange.com/questions/1362/latex-template-gallery

http://www.personal.ceu.hu/tex/cookbook.html

Latex for biologists
http://schneider.ncifcrf.gov/latex.html

Commands sequence
pdflatex templatePDF
bibtex templatePDF
pdflatex templatePDF

Beamer Presentation
https://www.youtube.com/playlist?list=PL8013BD91081DC008

Latex for biologists
http://schneider.ncifcrf.gov/latex.html

Friday, April 26, 2013

Summary of network clustering methods, in progress


Network clustering is discussed in graph-based models in Wikipedia's entry on Clustering analysis.

  • Hierarchical clustering using distance matrix
  • Xu,Xiaowei, Yuruk, Nurcan, Feng Zhidan, Schweiger Thomas, SCAN: A structural clustering algotihm for networks. 
  • Min-max cut method, C. Ding, X. He, H. Zha, M. Gu, and H. Simon, “A min-max
    cut algorithm for graph partitioning and data clustering”, Proc. of ICDM 2001.
  • Normalized cut, J. Shi and J. Malik, “Normalized cuts and imagesegmentation”, IEEE Transactions on Pattern Analysis and Machine Intelligence, Vol 22, No. 8, 2000.
  • Maximization of modularity, M. E. J. Newman and M. Girvan, “Finding and evaluating
  • community structure in networks”, Phys. Rev. E 69, 026113, (2004).


    Modularity can be calculated in igraph.
  • Markov chain clustering (MCL)
Related URLs
  • http://www.sixhat.net/finding-communities-in-networks-with-r-and-igraph.html